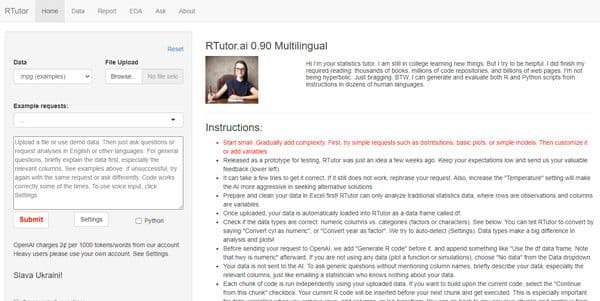
It writes R or Python code for data analysis when you describe what you want in plain language.
Coding & Dev
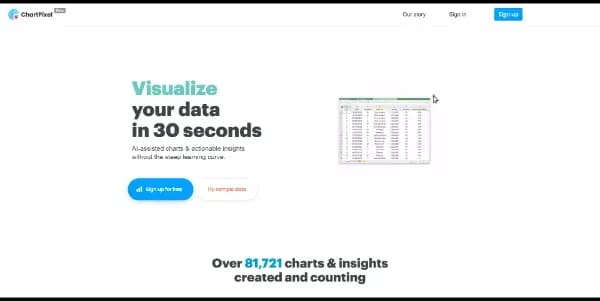
Instantly transform raw tabular data into statistically relevant, presentation-quality charts through automated data profiling.
Best for: Business analysts and non-technical stakeholders requiring rapid exploratory data analysis and presentation-ready visuals without configuring complex BI software.
It writes R or Python code for data analysis when you describe what you want in plain language.
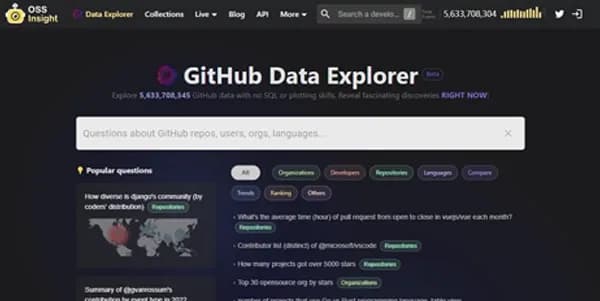
A data analytics tool that turns billions of GitHub events into interactive charts and insights about open‑source projects.
A specialized reasoning engine that transforms complex mathematical queries and handwritten formulas into verifiable, step-by-step symbolic solutions.